Trusted By 1000 Trucking Companies (4.7/5) Rating
Fix Your Trucking Business Without Guessing
Owner-Operators and Fleet Owners: Stop guessing why your money disappears.
The Truckin’ Techie Fast Track Audit™ reveals your top 3 blind spots, fixes your dispatch and financial leaks, and gives you a clear roadmap to scale — without a single coaching call.
Delivered in 24 hours
Customized to your business
Simple visuals — no spreadsheets
MONEY BACK GUARANTEE IF WE DON'T FIND 3 BLIND SPOTS.
You Can't Fix What You Can't See
Your audit gives you a clear picture of where your trucking business stands — and a step-by-step plan to tighten up your numbers and systems.

Does this sound like you?
You’re running loads nonstop but profit isn’t growing
You feel like you’re chasing loads instead of running a business
You’ve got no clear numbers, just gut feelings
Brokers and apps run your life — not a strategy
You’re not alone. Most small carriers and owner-operators bleed money because no one ever shows them how to see the leaks before it’s too late.
MONEY BACK GUARANTEE IF WE DON'T FIND 3 BLIND SPOTS.
You Can't Fix What You Can't See
Your audit gives you a clear picture of where your trucking business stands — and a step-by-step plan to tighten up your numbers and systems.
Does this sound like you?
You’re running loads nonstop but profit isn’t growing.
You feel like you’re chasing loads instead of running a business.
You’ve got NO clear numbers, just gut feelings.
Brokers and apps run your life — not a strategy.
You’re NOT alone. Most small carriers and owner-operators bleed money because no one ever shows them how to see the leaks before it’s too late.
MONEY BACK GUARANTEE IF WE DON'T FIND 3 BLIND SPOTS.
What You'll Get With Your Fast Track Audit
A one-time, high-impact diagnostic that cuts through the noise and shows you where your money is leaking, what's holding you back, and the exact steps to take within 90 days.
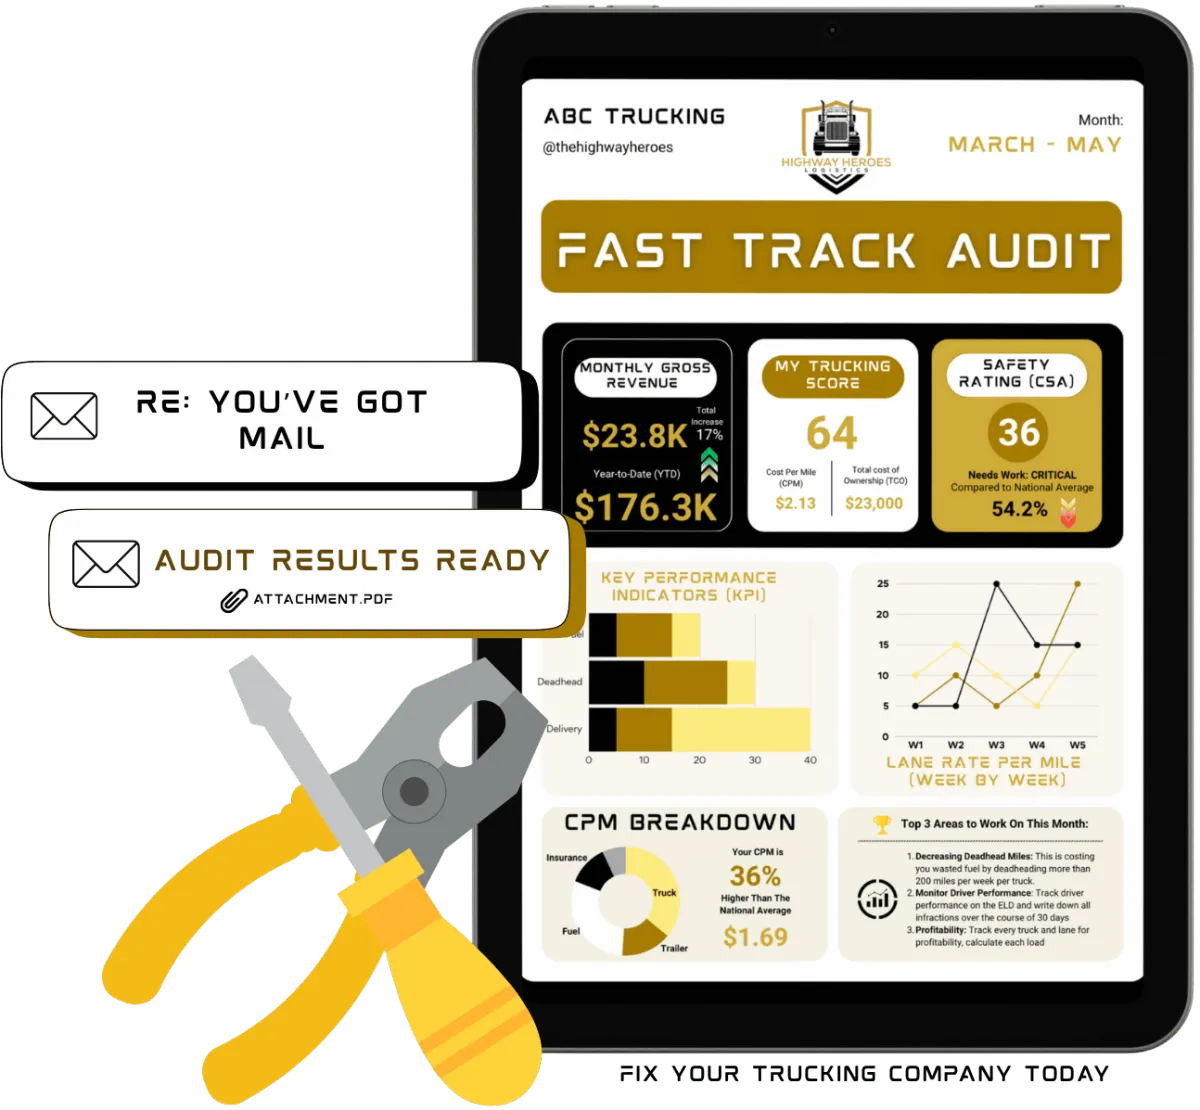
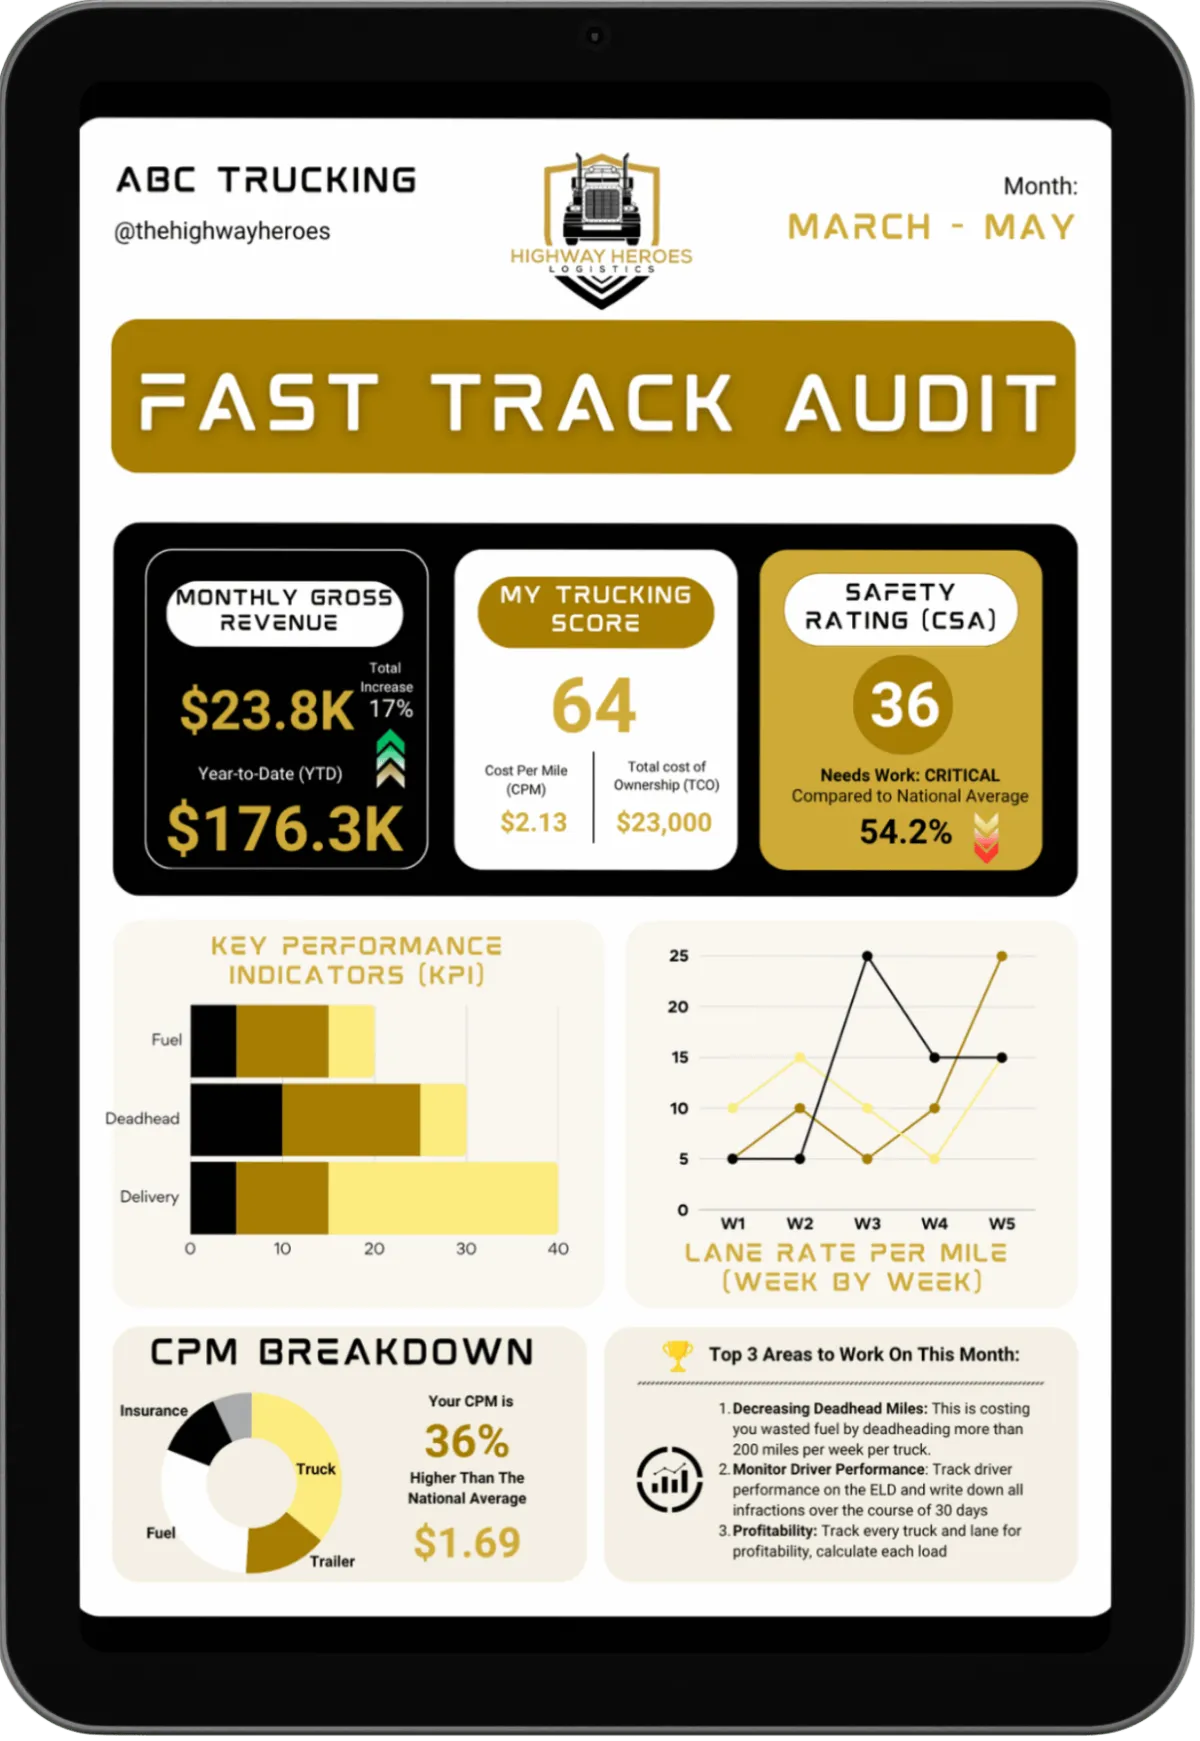
Fast Track Audit Report
Your no-BS breakdown of what’s really happening.
See your My Trucking Score and key business health metrics.
Uncover your Top 3 Blind Spots (explained in plain English).
Find financial leaks, compliance gaps, and dispatch inefficiencies.
Includes visuals of loads, RPM, and driver utilization

Personalized 30-Day Roadmap
Your step-by-step plan from chaos to control.
Quick Fixes (7 Days) - small moves, fast results
Medium Wins (30 Days)- build stability and structure
Foundation Work (90 Days) - scale and systemize
Intergrate technology & turn data into weekly decisions — not random guesses


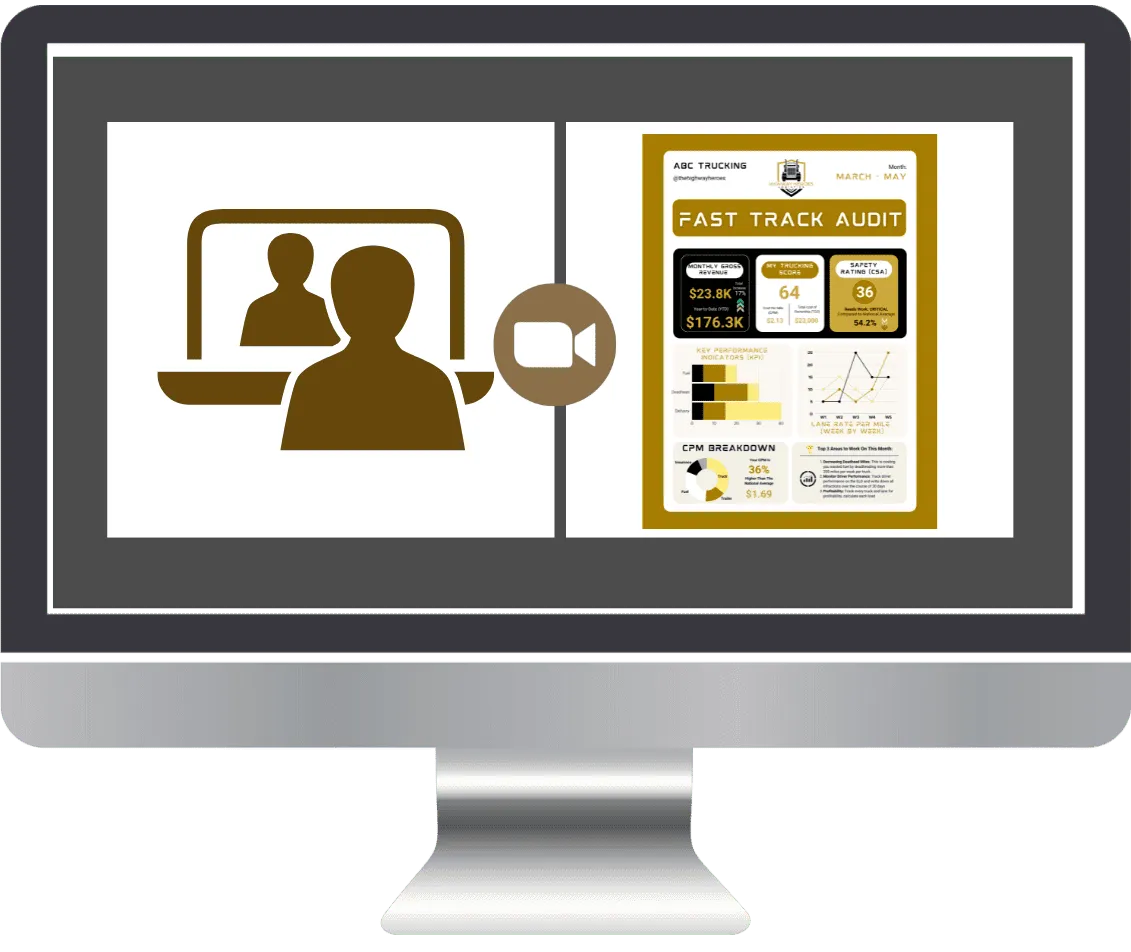
Personal Loom Walkthrough Video
Becase data means nothing if you don't understand it.
Personalized 5-7 minute walkthrough explaining your audit results.
Uncover your Top 3 Blind Spots (explained in plain English).
Find financial leaks, compliance gaps, and dispatch inefficiencies.
Delivered alongside yourt report - so you know what to do next

Bonus: Freight Pulse Snapshot
Only available if you share recent load data. **
Tracks profit per mile, load ratios, and empty miles in one simple chart.
Reveals the lanes and loads that make (or break) your margins.
See your fleet’s performance against national averages.
Can be updated monthly to see real time improvement **

Imagine running your business with absolute clarity and knowing exactly what to fix first.
MONEY BACK GUARANTEE IF WE DON'T FIND 3 BLIND SPOTS.
You could keep guessing… or get the roadmap
Most fleets lose thousands a month because they don’t see where the leaks are.
This audit gives you the data, clarity, and plan to stop the bleeding — fast.
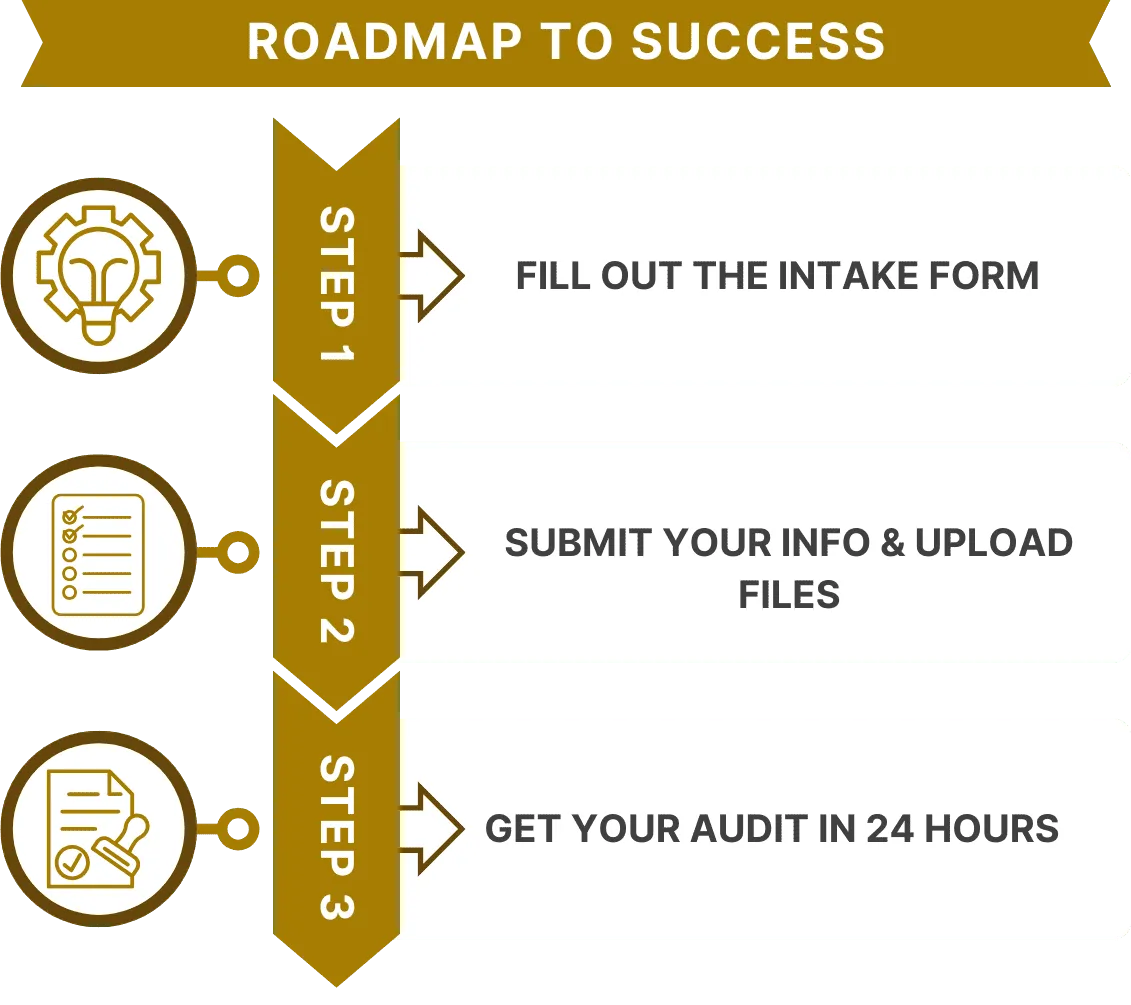
How It Works 3 Simple Steps
You’re 1 form away from your business making sense again.
Stop Guessing. Every Day You Wait Is Another Day of Wasted Miles and Lost Profit.
What You'll Get With Your Fast Track Audit
A one-time, high-impact diagnostic that cuts through the noise and shows you where your money is leaking, what's holding you back, and the exact steps to take within 90 days.
Fast Track Audit Report
Your no-BS breakdown of what’s really happening.
See your My Trucking Score and key business health metrics.
Uncover your Top 3 Blind Spots (explained in plain English).
Find financial leaks, compliance gaps, and dispatch inefficiencies.
Includes visuals of loads, RPM, and driver utilization
Personalized 30-Day Roadmap
Your step-by-step plan from chaos to control.
Quick Fixes (7 Days) - small moves, fast results
Medium Wins (30 Days)- build stability and structure
Foundation Work (90 Days) - scale and systemize
Intergrate technology & turn data into weekly decisions — not random guesses
Personal Loom Walkthrough Video
Becase data means nothing if you don't understand it.
Personalized 5-7 minute walkthrough explaining your audit results.
Uncover your Top 3 Blind Spots (explained in plain English).
Find financial leaks, compliance gaps, and dispatch inefficiencies.
Delivered alongside your report - so you know what to do next
Bonus: Freight Pulse Snapshot
Only available if you share recent load data. **
Tracks profit per mile, load ratios, and empty miles in one simple chart.
Reveals the lanes and loads that make (or break) your margins.
See your fleet’s performance against national averages.
Can be updated monthly to see real time improvement **
MONEY BACK GUARANTEE IF WE DON'T FIND 3 BLIND SPOTS.
You could keep guessing… or get the roadmap
Most fleets lose thousands a month because they don’t see where the leaks are.
This audit gives you the data, clarity, and plan to stop the bleeding — fast.
How It Works
3 Simple Steps
You’re 1 form away from your business making sense again.
MONEY BACK GUARANTEE IF WE DON'T FIND 3 BLIND SPOTS.
Stop Guessing. Every Day You Wait Is Another Day of Wasted Miles and Lost Profit.
Frequently Asked Questions (FAQ)
1. How fast will I get my audit results?
You’ll receive your complete Fast Track Audit — including your report, roadmap, and optional Freight Pulse Snapshot — within 24 hours of submission.
Everything is customized to your numbers, so you get real, actionable insight — not a copy-paste template.
2. What if I don’t understand the numbers or data?
That’s exactly why we include a personal Loom walkthrough video.
You’ll get a short 5–7 minute video where we break down your results in plain English — showing where your money’s leaking, what needs fixing, and the exact steps to tighten up your operation.
No spreadsheets, no jargon — just clarity.
3. What makes this different from a regular consultation or coaching call?
Traditional consultations tell you what’s wrong — the Fast Track Audit shows you why it’s happening and how to fix it in days, not months.
It’s data-driven, visual, and actionable — giving you a real roadmap to follow instead of a motivational pep talk.
You’ll walk away knowing your numbers, blind spots, and next moves — without a single coaching session.