
Learn About Our DIIO Algorithms
Combine our Trade Conditions checklist with the DIIO algorithms, and watch your win rate skyrocket.
Want more info on The DIIO Algos / Indicators? Login and explore.
Get access to exclusive DIIO content: PDFs and detailed explanation videos on each algo.
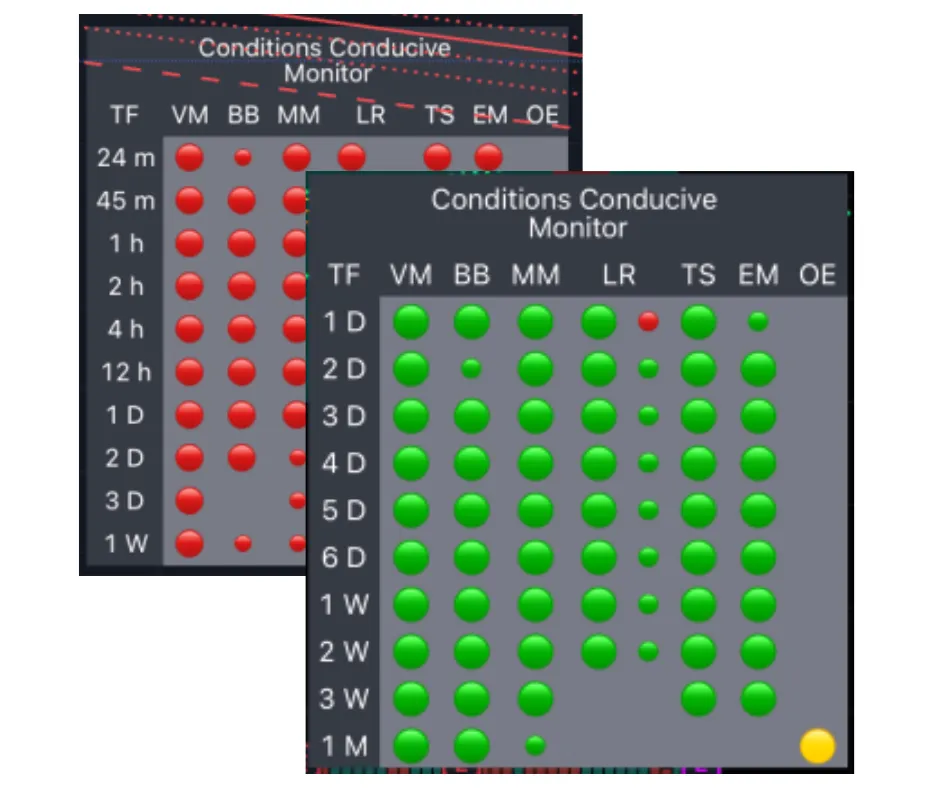
Conditions Conducive Monitor
CCM is a powerful tool for traders, combining multiple indicators to provide a comprehensive analysis of market conditions.
By using the CCM, traders can enhance their decision-making process, identify high-probability trading opportunities, and improve their overall trading performance.
Breakout Bars
The Break Out Bars algorithm is designed to help traders identify potential breakout points in the market. These breakout points indicate significant price movements, often leading to profitable trading opportunities.
These are the most sensitive of the algos and prone to strong swings especially in small timeframes so confluence from other metrics will be important.
Confluence Monitor
A table which monitors various inputs across multiple assets and timeframes to see where shorts/longs are indicated.
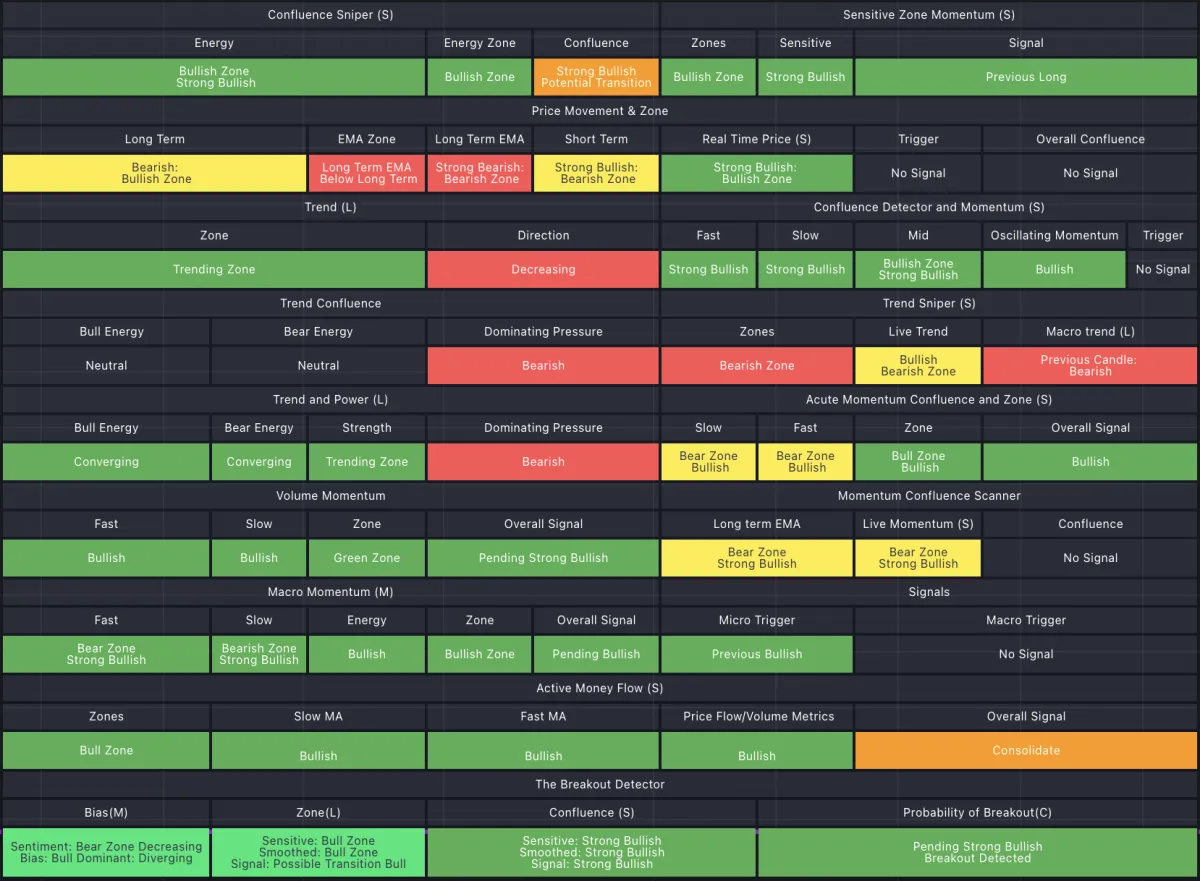
Confluence Monitor
A table which monitors various inputs across multiple assets and timeframes to see where shorts/longs are indicated.
Movement Monitor
The Movement Monitor algorithm is designed to help traders track and analyze market movements through a color-coded line on the chart.
This algorithm provides a visual representation of market momentum, making it easier for traders to identify trends, volume and potential trading opportunities.
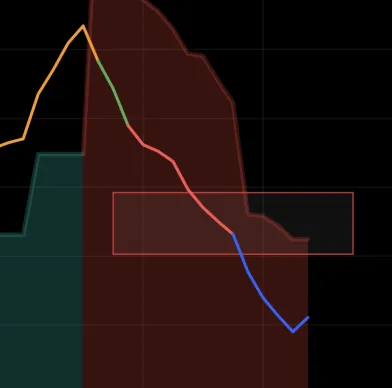
Volatility Monitor
The Volatility Monitor algorithm is designed to help traders identify potential for volatility in the market.
By monitoring potential for volatility, traders can make informed decisions about when to enter or exit trades, use stop losses and manage risk more effectively.
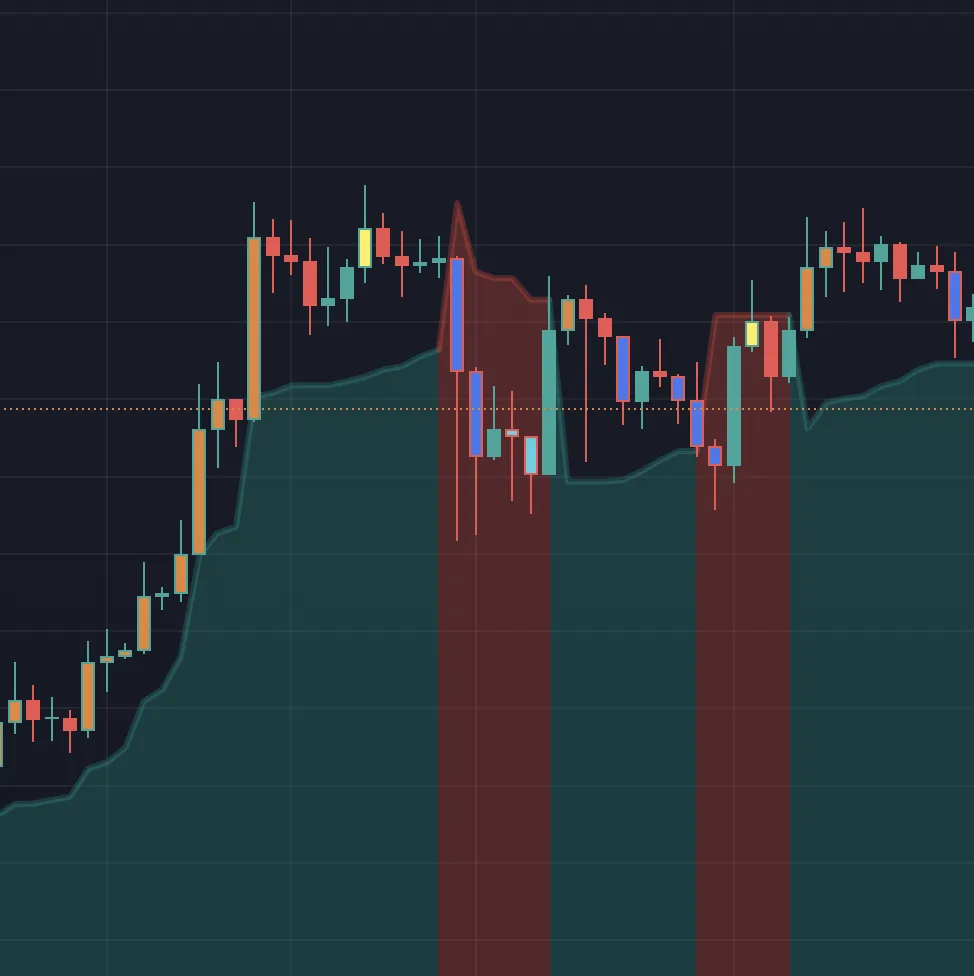
Volitility Monitor
Colored clouds (green, red) that provide volatility considerations and support/resistance levels based on recent price action.
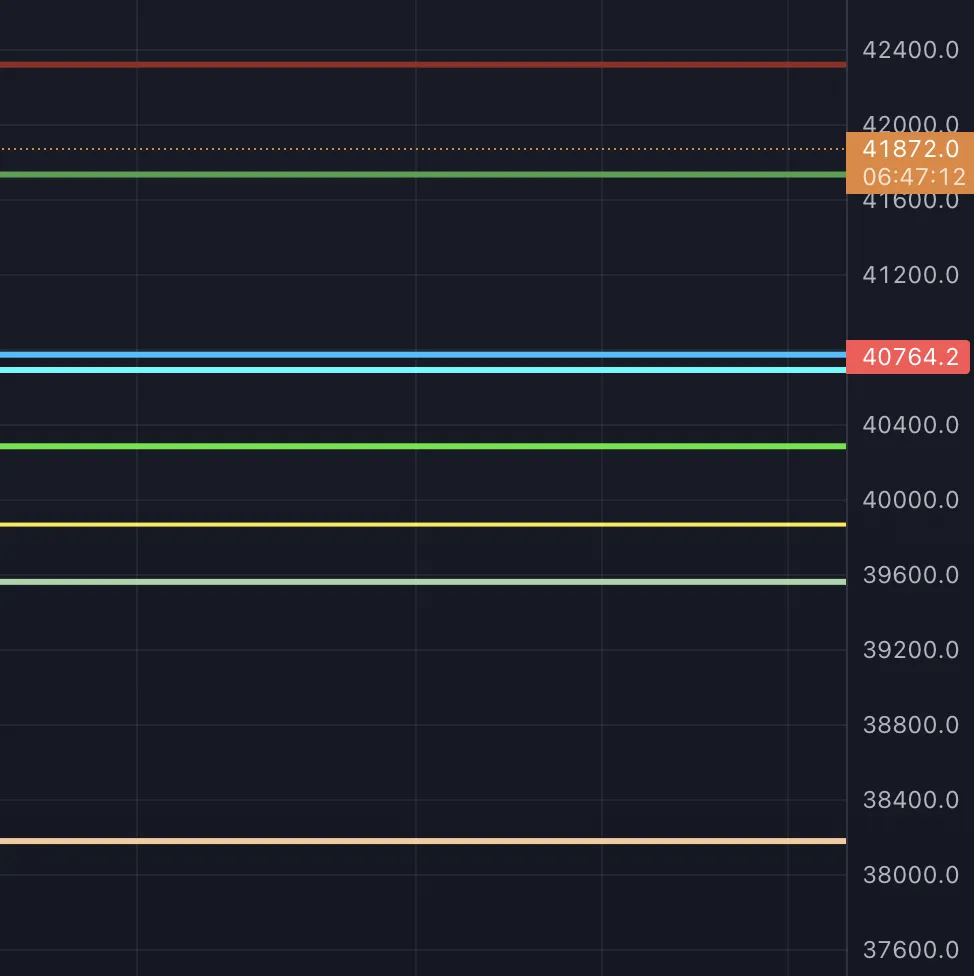
Dynamic Pressure Lines
The Pressure Lines algorithm is designed to help traders identify pressure points in the market where significant price movements are likely to occur.
These pressure points are areas where buying or selling pressure is likely to be present. This can be useful in identifying potential breakouts or reversals.